
Redhawks vs Lancers


Tip10:00 PM ET
Watch
LineNot posted
Win probability
1912 blend36% SEACBU 64%
CBU +3.1
Proj. margin
141.9
Proj. total
69.3
Proj. pace
Home court counts 3 points. Blend of Adj. efficiency, SRS and Elo.
Projected starters
PPG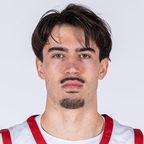 5F · 5.7 RPG18.7
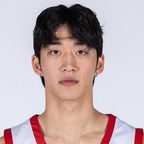 21F · 2.7 RPG7.0
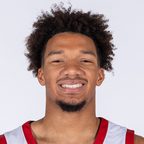 0G · 3.0 APG11.3
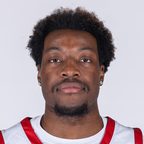 65F · 7.7 RPG9.0
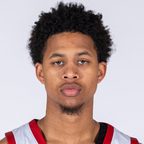 2G · 2.0 APG19.0
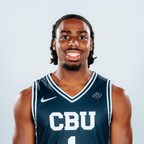 13.0 RPG14.0
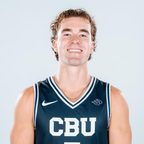 7G · 0.7 APG4.7
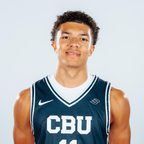 11G · 2.7 APG9.7
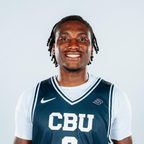 6F · 5.0 RPG9.3
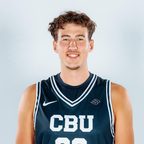 223.0 RPG4.7
Ratings
CBBD · 2025-26+5.5Adj. net rating+5.9
110thAdj. net rank106th
103.2Adj. offense107.4
97.7Adj. defense101.5
71.5Pace67.0
1.5SRS3.6
1816Elo1895
1–2Record0–3
Season per game
2026-27 · 3 games70.3Points64.3
73.3Opp points82.7
50.6%eFG%46.1%
21.0%TO%19.0%
27.5%OREB%31.7%
.48FT rate.34
36%3PA rate47%
40%Assisted FG%55%
Last five games
Seattle U
L59-86vs UTSA
W79-60vs PRST
L73-74@ HAW
L85-91@ AUB
W67-52vs STMN
California Baptist
L62-81vs CHST
L68-96@ ORST
L63-71vs UNF
L60-68@ KU
W63-61@ UVU
Head to head
Last 10 · 2017-18–2026-2724-25CBU 48 · SEA 72Thu, 2/27
24-25SEA 59 · CBU 61Sat, 1/4
23-24CBU 57 · SEA 81Thu, 3/14
23-24SEA 61 · CBU 60Sat, 2/3
23-24CBU 46 · SEA 48Sat, 1/6
22-23SEA 63 · CBU 84Wed, 2/15
22-23CBU 65 · SEA 71Sat, 12/31
21-22CBU 64 · SEA 67Sat, 2/19
21-22SEA 92 · CBU 85Mon, 1/17
20-21SEA 83 · CBU 66Thu, 3/11
Game information
TipTuesday, Nov 17 · 10:00 PM ET
VenueDale E. and Sarah Ann Fowler Events Center · Riverside, CA
WatchESPN+
Abbreviations
Adj.Adjusted — points scored or allowed per 100 possessions, corrected for the strength of the opponents faced. Net is offense minus defense
SRSSimple Rating System — average scoring margin, adjusted for strength of schedule
EloA rating that moves after every result, by more when the opponent was strong
PacePossessions per 40 minutes
PPGPoints per game
eFG%Effective field goal percentage — made threes count one and a half field goals
TO%Turnovers per 100 possessions
OREB%The share of a team's own missed shots it rebounds
FT rateFree throws attempted per field goal attempted
3PA rateThe share of field goal attempts taken from three
Scores, plays and box from CollegeBasketballData
An independent fan community, not affiliated with the University of Louisville.